|
Home > XML IDE - XML Editor > XML Editor Key Features > XQuery Tools > XQuery Debugger
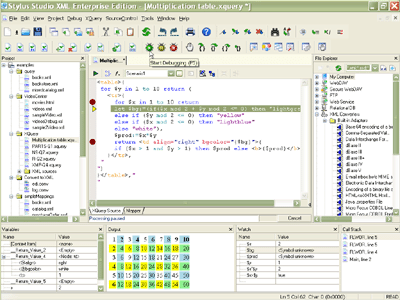
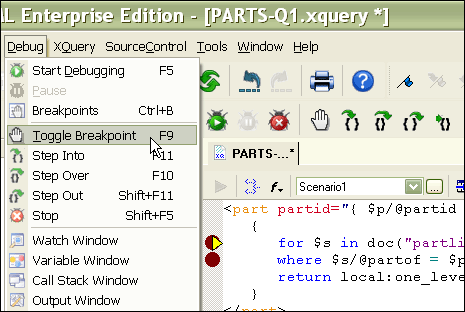
XQuery DebuggerStylus Studio® features a powerful XQuery Debugger (illustrated below — click to enlarge) that allows you to set breakpoints and step through the evaluation of any XQuery expression in a way that gives you complete control and visibility into the XQuery expression evaluation process. Our XQuery Debugger simplifies the development of advanced XQuery expressions by helping you find and eliminate unwanted bugs in the development phase, ensuring that things work as expected when it comes to deploying your XQuery application. Stylus Studio® is the first and only XQuery Debugger to fully support the W3C XQuery 1.0 Candidate Recommendation of November 2005. A new online video demonstration shows some of the highlights of our integrated XQuery development tools, and the features are described in detail here. Set/Toggle Breakpoints in the XQuery DebuggerStart XQuery debugging in Stylus Studio® by first setting one or more breakpoints in your XQuery code — to do this, press the F9 key, then click on the Start Debugging button (or press the F5 key). Breakpoints in Stylus Studio® are represented by the red circles located in the left margin of the main XQuery editing window. In the following illustration, see how Stylus Studio has placed breakpoints at the for and where clauses of an XQuery FLWOR expression. To toggle an XQuery breakpoint, move your cursor to the line containing the breakpoint you want to toggle, then press the F9 key again.
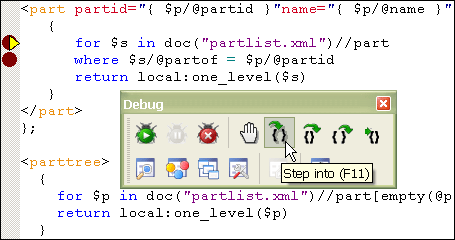
Step In, Step Out, and Step Over Your XQuery CodeStylus Studio®'s XQuery Debugger allows you to step through your XQuery code, line by line, allowing you to analyze every step of the XQuery execution process which can be very handy in helping ensure correct program behavior, and also provide insight on understanding how XQuery works. By clicking the "Step-into" button (F11), the next line of XQuery code is executed; "Step-out" (F10) causes XQuery processing to advance until the end of the current block; "Step-over" (SHIFT-F11) executes an entire XQuery code block and returns to the following line.
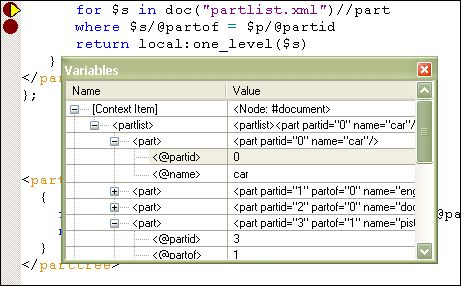
Watch XQuery Variables and ExpressionsStylus Studio® makes it easy to set watches on different variables and XQuery expressions whose values often get updated as the XQuery processor's context changes. In the example illustrated below, see how easy it is to monitor the value of various XQuery values and expressions as we step through the execution of an XQuery expression. The variable values are updated in real time, and the Watch Window supports a tree-like interface since variables in XQuery are often represented as an XML tree-structure.
Support for XQuery Debugging in SaxonIn addition to providing XQuery debugging and editing support based on our own built-in XQuery processor, Stylus Studio also provides fully integrated XQuery debugging using the Saxon SA 8.6 XQuery processor a widely-adopted, high-performance XQuery engine. The integration is seamless — to use the Saxon XQuery processor, just choose it from a combo-box as in the XQuery processor setting window as illustrated below. just don't roll the dice with other XML tools that are based on un-scalable and proprietary XML processing components. Debug XQuery Extension Functions, Too.Stylus Studio® is the only XML IDE to fully support debugging of Java XQuery extension functions. This means that when you are debugging your XQuery code, if you happen to encounter an extension function, you can optionally step into it using our integrated Java IDE. The integration is seamless and you can pass parameters back and forth between your XQuery and Java code. We think that our integrated XQuery and Java debuggers are much more helpful than other XML IDEs that simply crash when you hit an extension function. Eliminate XQuery Debugger is an essential tool for XQuery developers because it lets you ison
|
PURCHASE STYLUS STUDIO ONLINE TODAY!!Purchasing Stylus Studio from our online shop is Easy, Secure and Value Priced! Try Stylus Powerful XQuery DebuggerEliminate XQuery errors with the industry-standard XQuery debugger - Download a free trial today! What's New for Stylus Studio® X16?New XQuery & Web Services Tools, Support for MySQL, PostgreSQL, HL7 EDI, Microsoft .NET Code Generation and much more! Ask Someone You KnowDoes your company use Stylus Studio? Do your competitors? Engineers from over 100,000 leading companies use Stylus Studio, and now you can ask someone from your own organization about their experiences using Stylus Studio. Top Ten XQuery TrendsRead about the top 10 XQuery Trends and how they will impact change the way enterprise software applications are built. |
XML PRODUCTIVITY THROUGH INNOVATION ™

 Cart
Cart


