|
Home > Learn XML > XML Tutorials > Mapping Farmers' Markets
Mapping Farmers' Markets in Google Earth using XSLT(click images to see full size) In the last few years, governments around the world have started investing significant resources to bring a tremendous amount of data online and to make it available to the public, not only to improve transparency but also to enable third parties to build very interesting applications. In the US, the government runs http://datagov.gov, a large collection of data sets that include information on climate, biology, ecology, economy and human health, just to mention a few. This fascinating archive includes an interesting document entitled “Farmers’ Markets Geographic Data”. While our society is maturing, we have come to realize the importance of buying fruit and vegetables locally to reduce carbon emissions and to help the local economy. 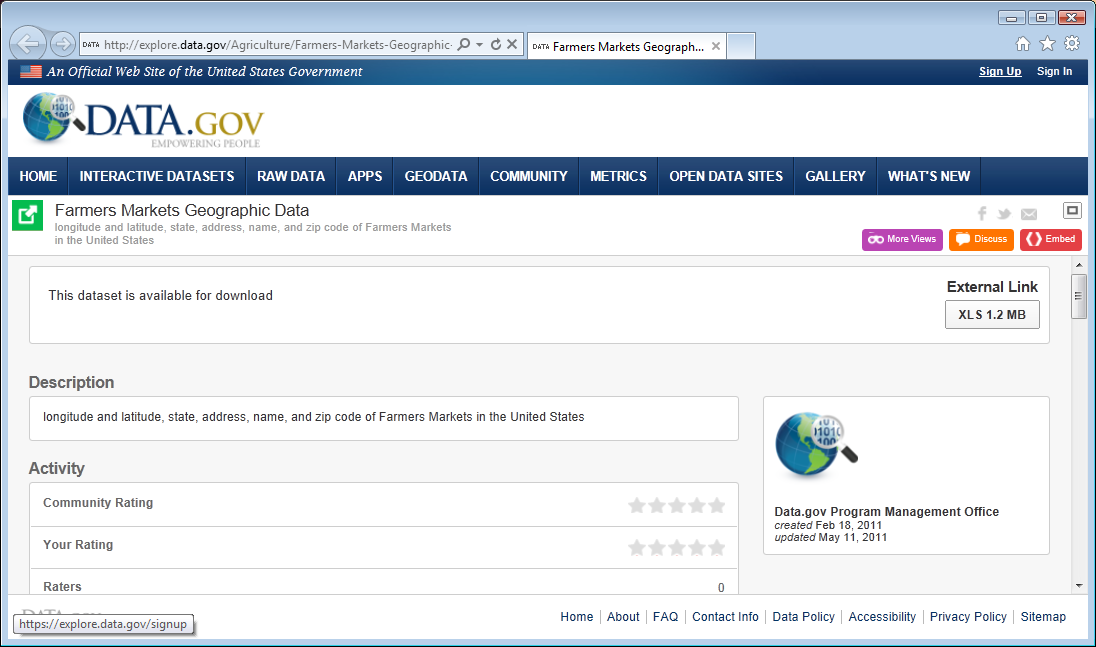 I thought it would useful to be able to convert the report to a format that can be rendered on a map to easily determine which markets are located near me. 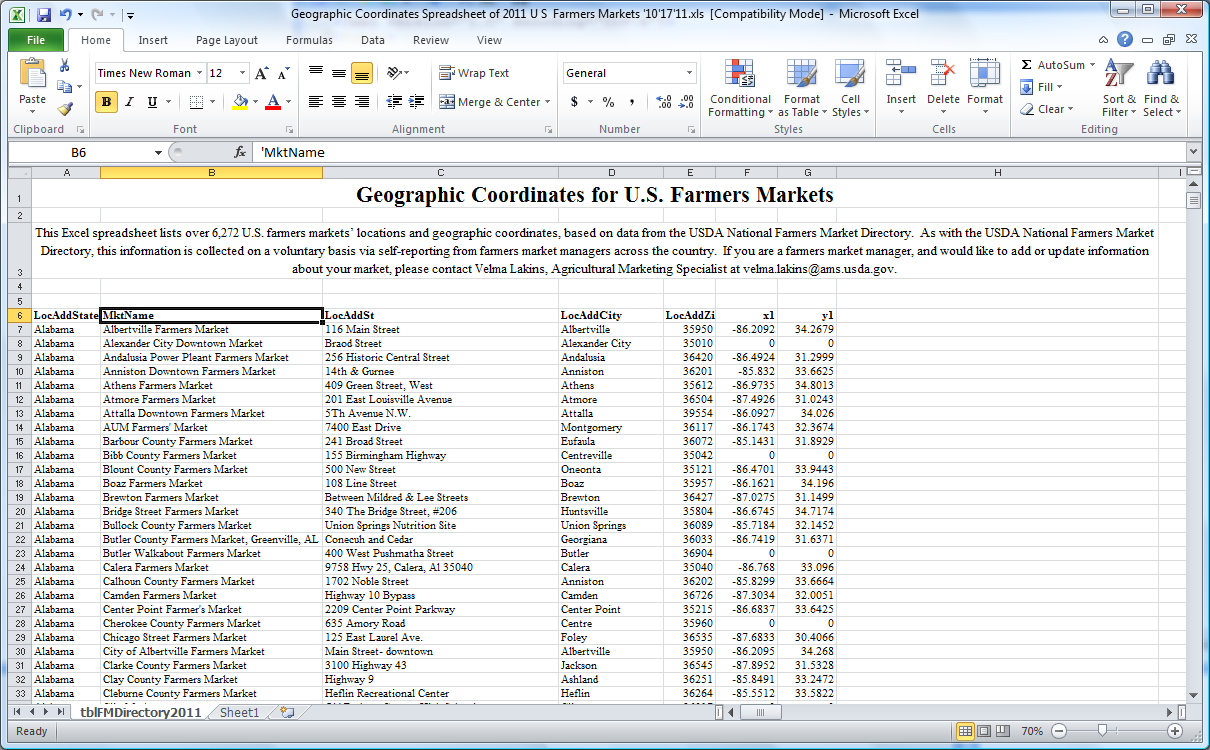 This particular report is in Microsoft Excel format and can be easily loaded into Stylus Studio using the built-in CSV to XML converter. Notice that the property named “first” is set to yes, in order to instruct Stylus Studio to interpret the first line of the CSV as a column header. 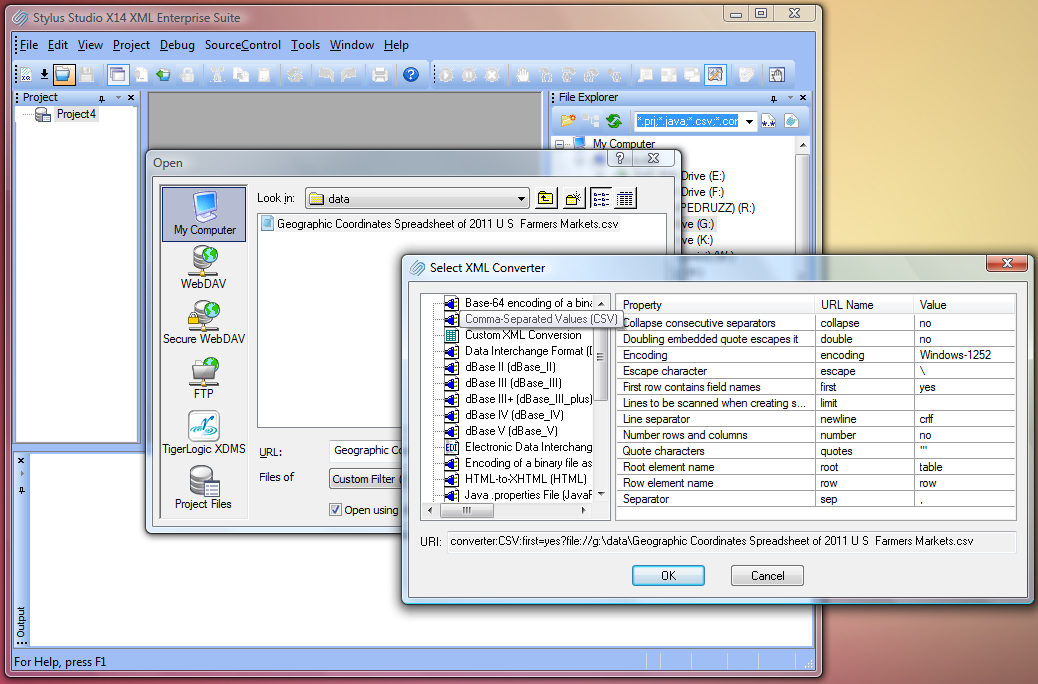 After we commit the dialog, the data appears as XML. The tooltip reveals that we are still pointing to the underlying CSV file while looking through an “XML View”. This approach allows us to manipulate the data using standard XML transformation languages, such as XSLT, to reshape, to transform and to query our input documents. Stylus Studio provides a large variety of XML converters including a very rich support for Electronic Data Interchange (EDIFACT, X12, IATA, HIPPA, etc.) 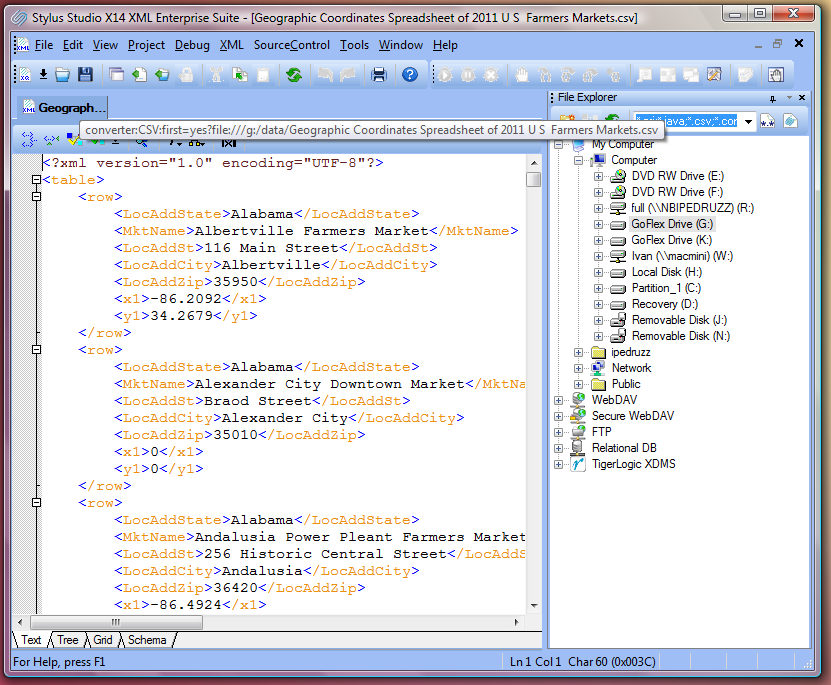 Google Earth, a popular geographical mapping tool, allows the importing of data overlay using an XML based format called KML http://code.google.com/apis/kml/. The schema for KML can be found at https://developers.google.com/kml/schema/kml22gx.xsd. This seems to be a great target for our project. We will use Stylus Studio to transform CSV data into KLM using XSLT. The first step is to iterate through each element “row” in our input document and output a sequence of Placemark elements. We accomplish this in Stylus Studio by drawing a line from left to right using the mouse right button. When we release the button, we can select which link to create. In our case we need a repeatable link. In response Stylus Studio creates a xsl:for-each instruction. 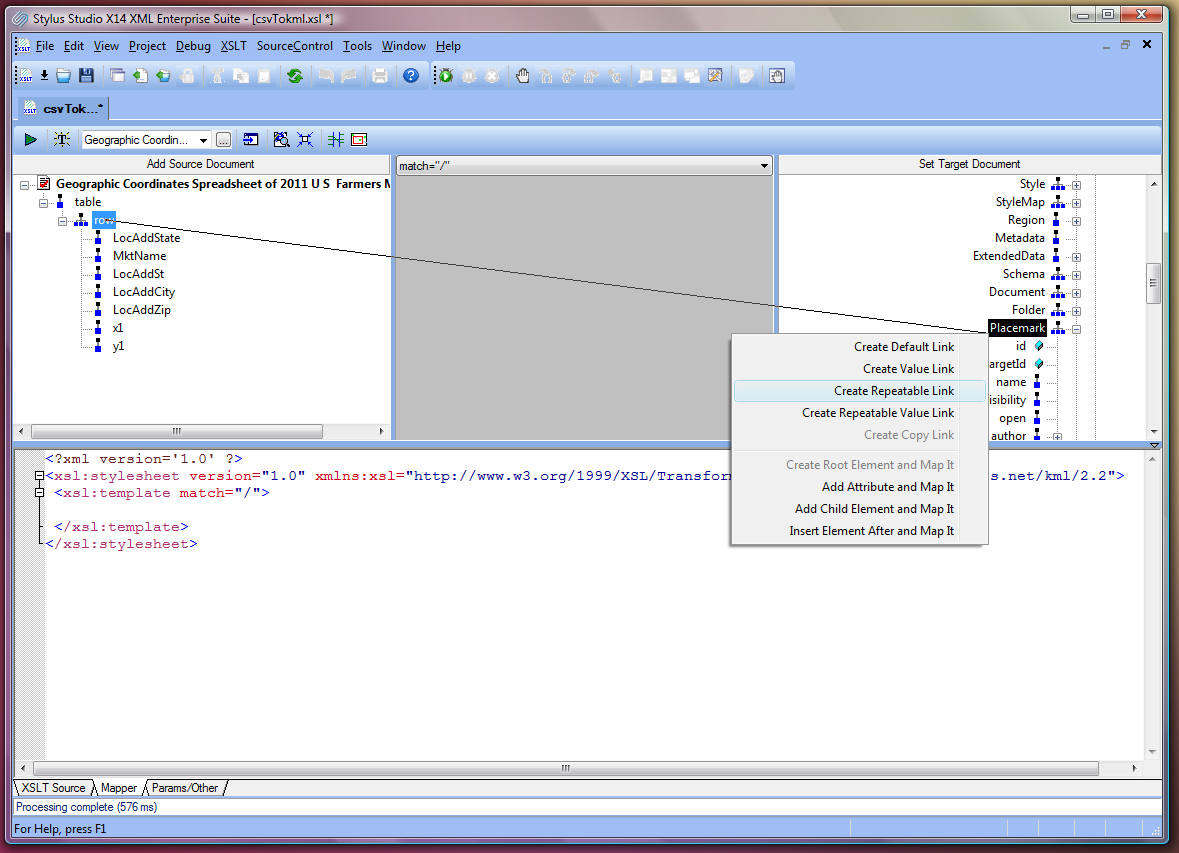 We now link the farmers’ market’s name to the PlaceMark name. In this example, we want to focus on markets that are in Massachusetts only. To accomplish this, we will add an xsl:if instruction. We must change the link routing from the xsl:for-each on each output port to a xsl:if control port. Then we can map the xsl:if output port to Placemark in the target tree. We then use the operator “=” to test if the state is equal to Massachusetts. The Stylus Studio XSLT mapping feature allows the developer to have multiple input schemas in case joining multiple data sources into a single output schema is needed. 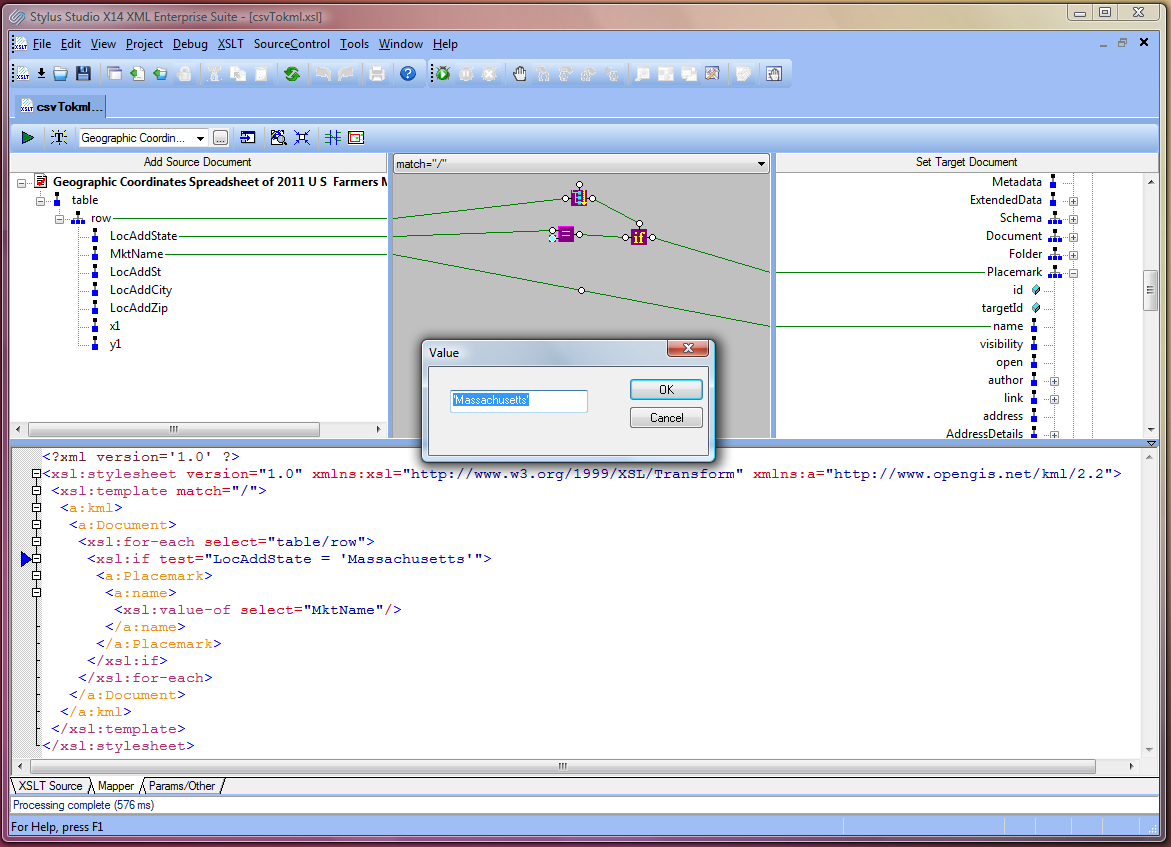 The next step is to output the coordinates into the element “coordinates” so Google Earth can place the markets in the appropriate geographical location. KML represents coordinates as single value with longitude and latitude separated by the character comma. To merge element “x1” and “y1” into element “coordinates”, we use the standard XPath function concat. 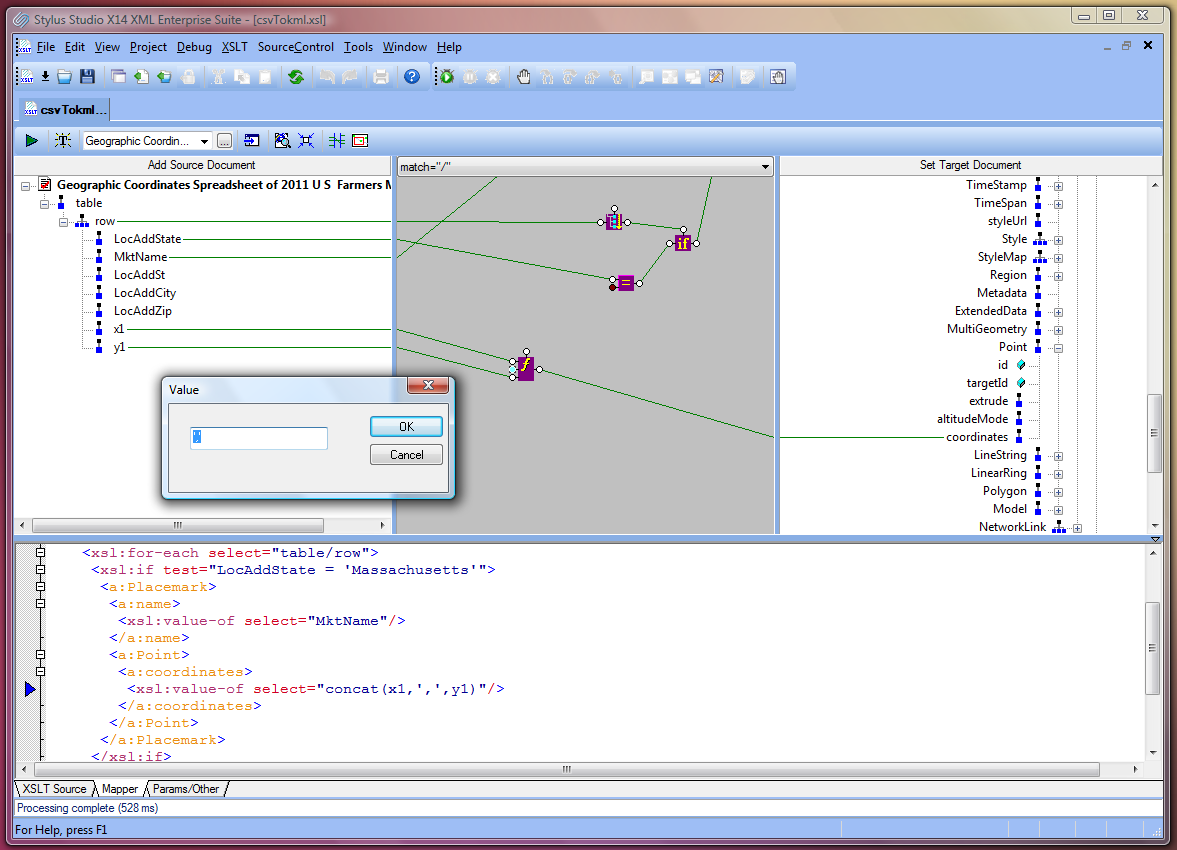 Our transformation is completed. We can click on the green play button in the toolbar and see the result in the preview window. The result is a KML document. If we click on any element in the output window, Stylus Studio shows the stack trace and the location of the XSLT instruction that originated it. 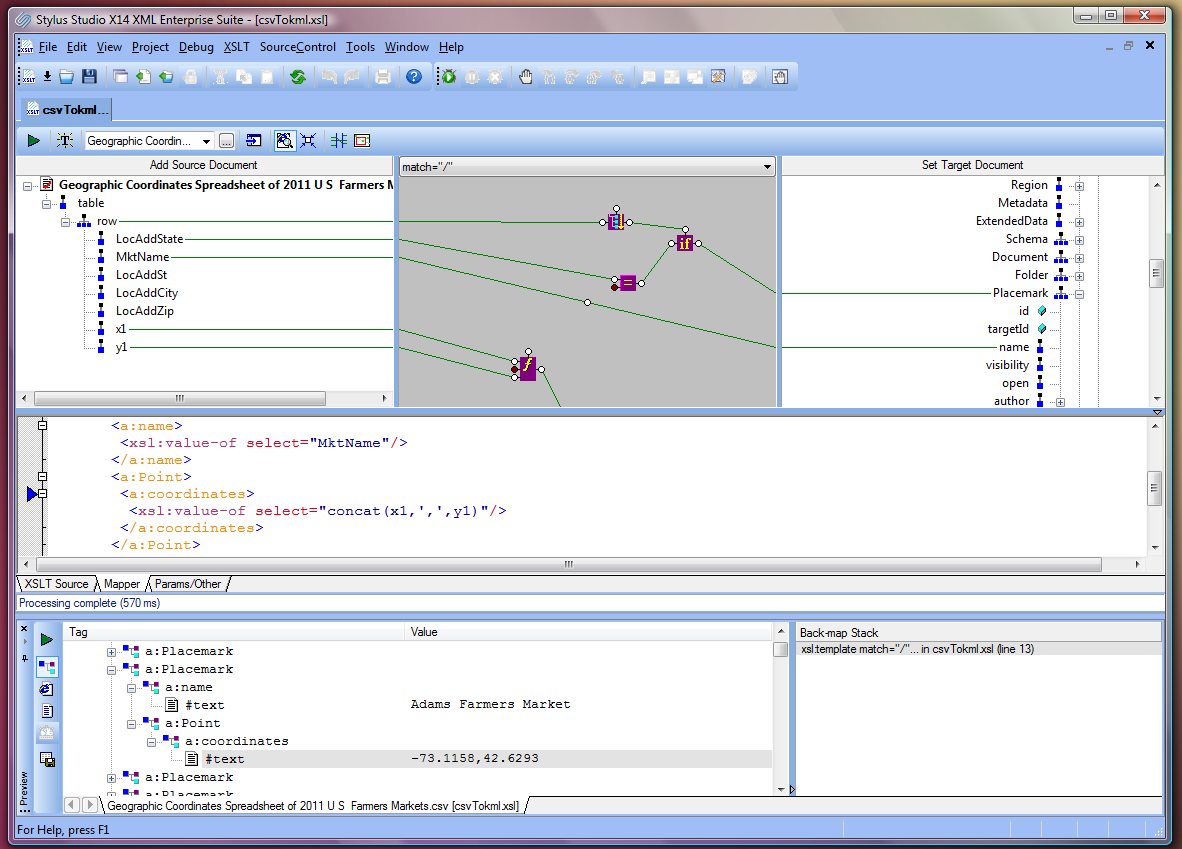 We want to be sure that, our XML output conforms to the KML schema, therefore, we need to set a validation step in the scenario dialog. Stylus Studio supports a variety of schema processors including Saxon, MSXML, .Net and Java built schema processors. When we execute the transformation again, Stylus Studio runs the schema processor on the transformation result and shows the validation output in the Output window. Our output document is valid; we can continue. 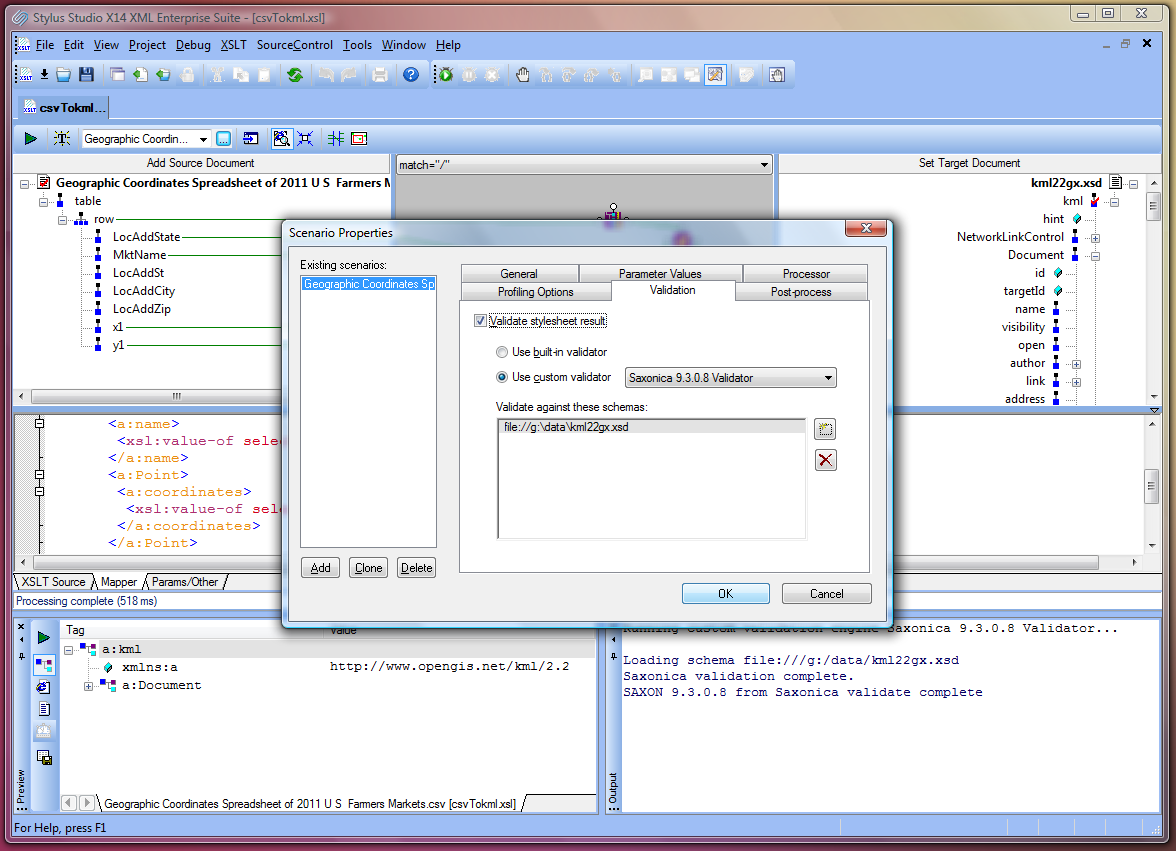 We also want to save the output on disk every time we run the transformation. This is done by setting the output URL in the scenario dialog. 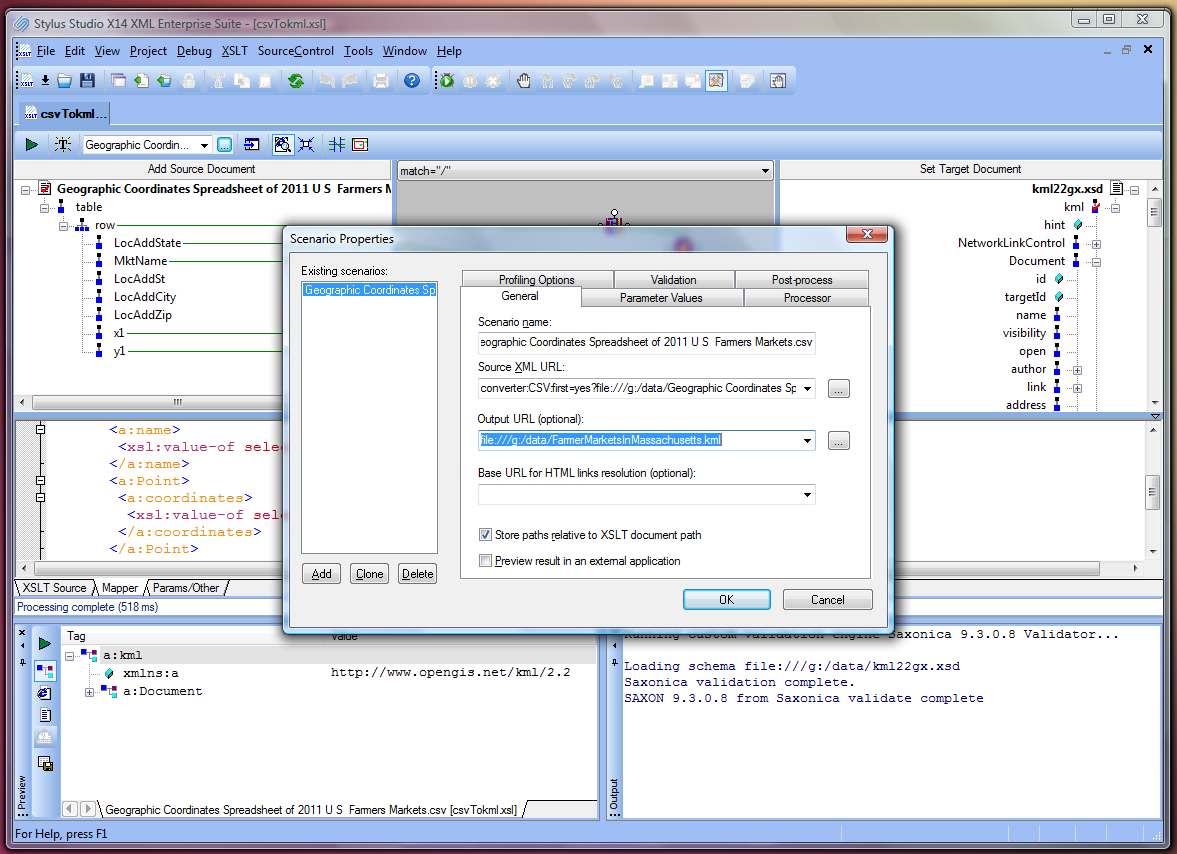 It is time to launch Google Earth and have a look at our beautiful planet from space. We can load the KML overlay into the map using the document we have generated with the Stylus Studio XSLT mapping tool. 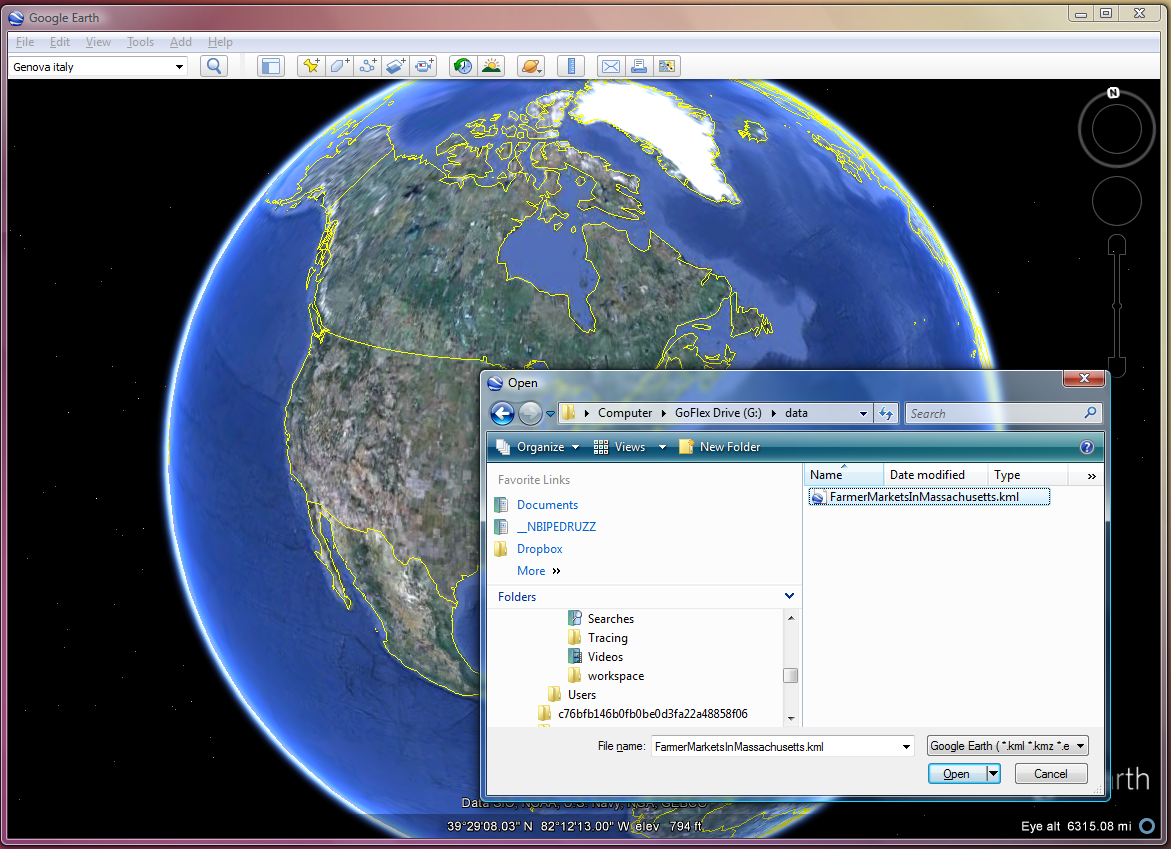 In the following screenshot, we have zoomed into the Boston north west area where we can clearly see a large number of farmers’ markets. Mission accomplished, thanks to the Stylus Studio powerful XML to XML mapping tool and its CSV converter technology. 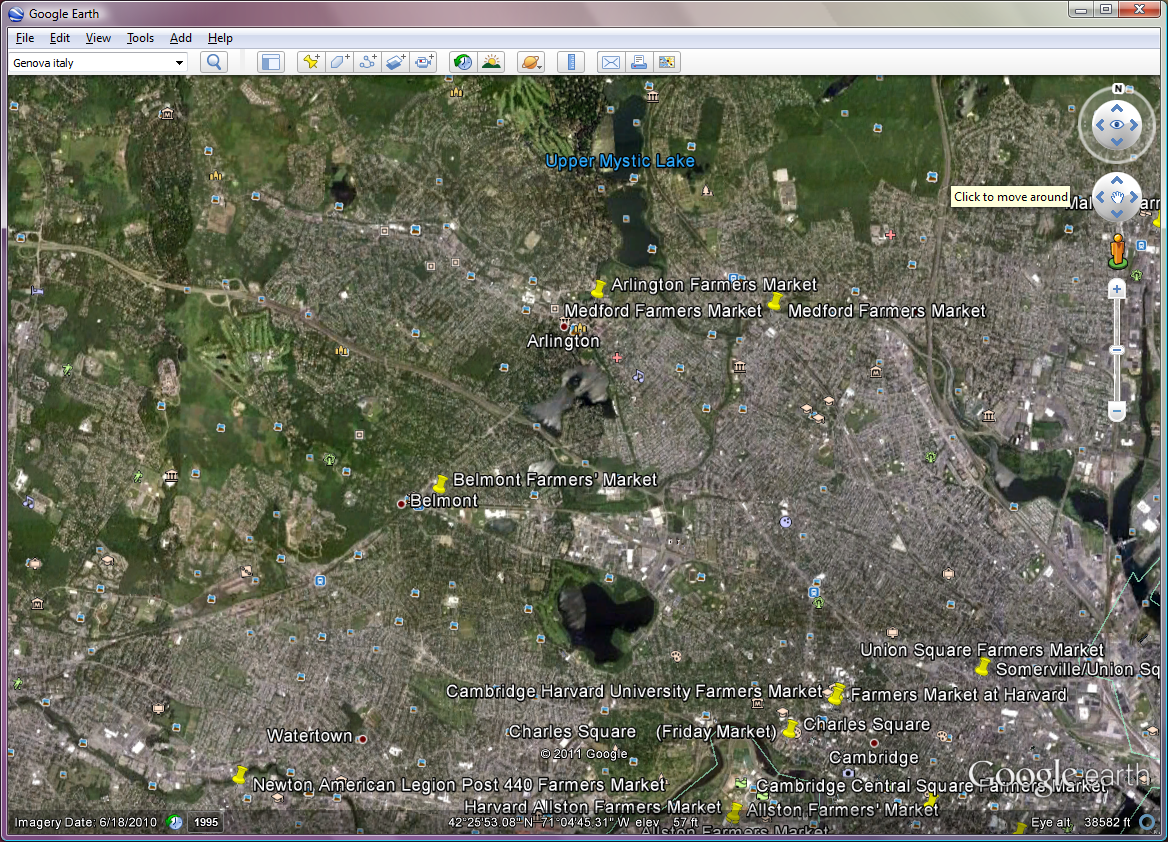
|
PURCHASE STYLUS STUDIO ONLINE TODAY!!Purchasing Stylus Studio from our online shop is Easy, Secure and Value Priced! Try Stylus Powerful XQuery IDEDownload a free trial of our award-winning IDE for XQuery today! Learn Stylus Studio in 6 MinutesCan six minutes change your life? A new action-packed online video demonstration covers how to use Stylus Studio in just six minutes! Watch this video and change the way you develop XML applications forever! Why Pay More for XML Tools?With Stylus Studio® X16 XML Enterprise Suite, you get the most comprehensive XML tool suite at one incredibly low price. Value: it's just one of many reasons why smart XML developers are choosing Stylus Studio! Top Ten XQuery TrendsRead about the top 10 XQuery Trends and how they will impact change the way enterprise software applications are built. |
XML PRODUCTIVITY THROUGH INNOVATION ™

 Cart
Cart


