Home > XML IDE - XML Editor > Screenshots > XSL Debugger
XSL Debugger
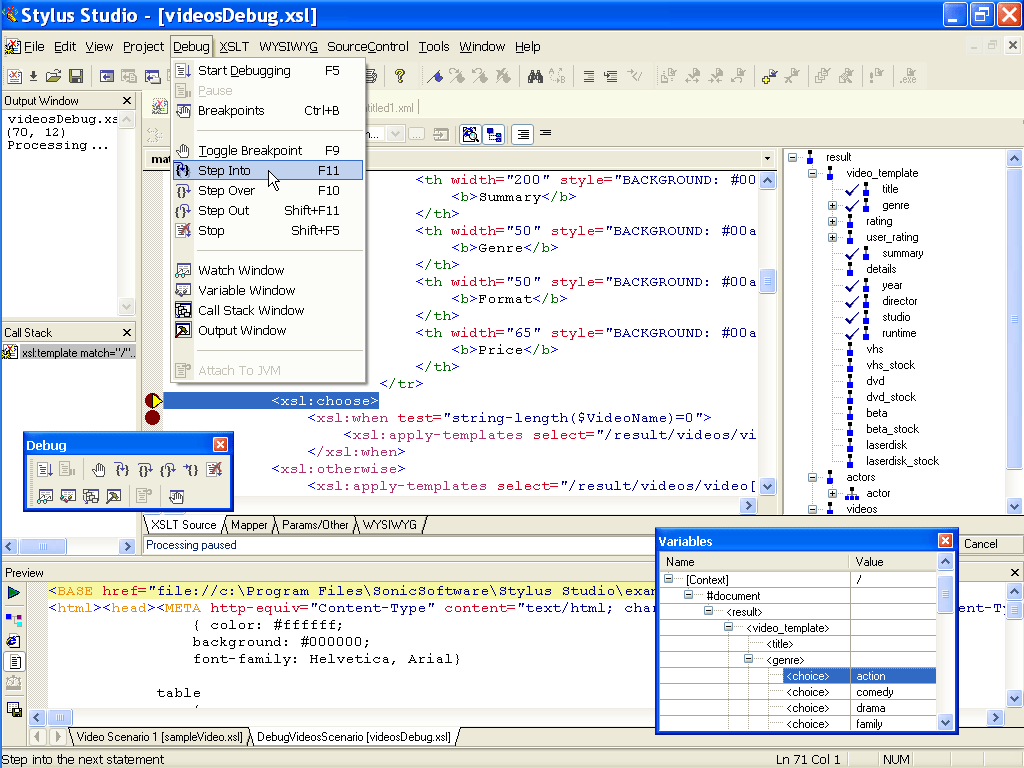
Stylus Studio's powerful XSL Debugger (Illustrated below) allows you to take full control over every step of the XSL stylesheet transformation process allowing you to isolate, debug and eliminate the most tricky XSLT bugs. Stylus Studio's XSL stylesheet debugger supports setting of XSL breakpoints, incremental execution of XSL stylesheet code (step-in, step-out, step-over), an XSL Variables Window that displays all XSL Variable names & values evaluated against the current context, an XSLT call stack window, an Output Console Window (to report error messages from the XSL processor), and a powerful real-time, incremental XSL Output Preview Window that displays the XSL output tree as it is being constructed. The XSL Output Preview Window supports backmapping, which means if you click on a line of generated output, Stylus Studio will highlight the line of the XSL stylesheet which generated that output, further helping you to isolate problems. Advanced XSL debugger features include the ability to seamlessly switch contexts and step into Java XSLT extension functions using Stylus Studio's integrated Java IDE, then returning back to calling the XSLT stylesheet. Stylus Studio's XSL stylesheet debugger works with any XSL processor, including Saxon, MSXML and System.XML (the new Microsoft.NET XSL processing API).

More Stylus Studio Screenshots
- XML Development Environment
- Java Code Generator
- XML Diff Tool
- XML Grid Editor
- Converting to XML
- XML Mapper
- XSL Editor
- HTML-to-XML Importer
- XSL:FO Editor
- XSL Debugger
- XSLT WYSIWYG Designer
- XSLT Profiler (Optimize XSLT Stylesheets)
- XML Schema Designer
- XML Schema Mapper
- XML Schema Validator
- XML Schema Documentation Generator
- OASIS Catalog Support
- Database-to-XML Data Source Editor
- Document Type Definition Editor
- XQuery Mapper
- XQuery IDE
- XQuery Debugging
- XQuery Profiler (Optimize XQuery Expressions)
- Web Service Call Composer (SOAP Tester)
- Java IDE

 Cart
Cart

