Home > XML IDE - XML Editor > Screenshots > Optimize XSLT Stylesheets
Optimize XSLT Stylesheets
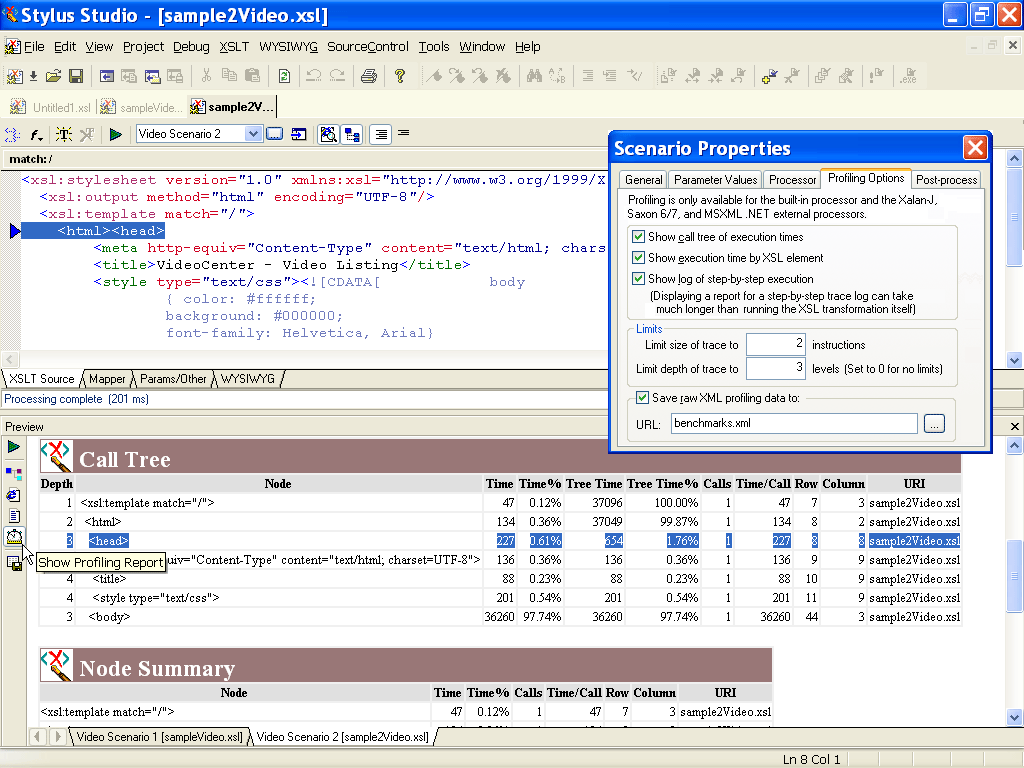
Stylus Studio®'s XSLT Profiler, illustrated below,
enables you to trace every detail of your XSLT stylesheet transformation, allowing you to create detailed performance benchmarks,
identify potential stylesheet bottlenecks, and to visually troubleshoot and eliminate them, thus optimizing your
XSLT stylesheet's overall performance. Illustrated below is an XSLT stylesheet transformation performance profile
report as analyzed by Stylus Studio®. You can configure the way Stylus Studio® benchmarks an XSLT stylesheet,
for example, by specifying the maximum depth for a trace, and what parameters to monitor.
A detailed execution tree with various performance metrics including depth, node,
execution time, percent of execution time, and so on, is displayed in the
Preview window at the bottom of the Stylus Studio® desktop.
Stylus Studio®'s XSLT profiler supports a powerful backmapping feature that allows you to click on any line in the Profiler Report,
which will result in the highlighting of the line of XSLT stylesheet source code corresponding to the particular entry in the call or
node summary. Using backmapping, it is easy to identify bottlenecks, make edits, then re-execute the XSLT stylesheet transformation,
and compare results. Stop throwing away money at expensive hardware based XML processing appliances and learn just how easy
it is to write faster XSLT stylesheets today!


 Cart
Cart

