|
Home > Online Product Documentation > Table of Contents > Profiling XQuery Documents Profiling XQuery Documents
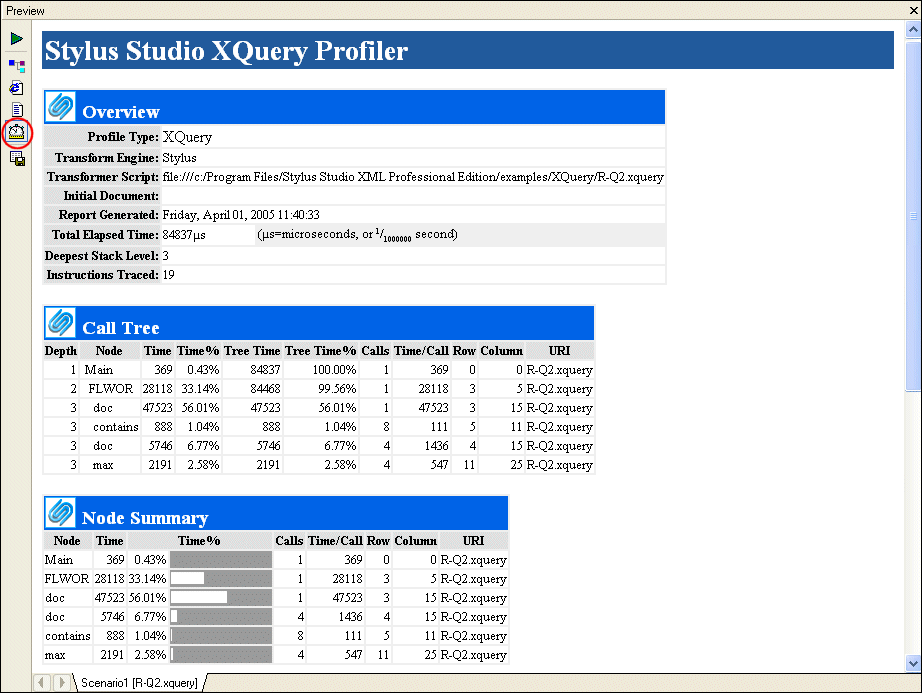
In addition to debugging tools for XQuery, Stylus Studio provides the XQuery Profiler, a tool that helps you evaluate the efficiency of your XQuery. By default, the performance metrics gathered by the XQuery Profiler are displayed in a preformatted report, like the one shown here:
The report format is controlled by the default XSLT stylesheet,
profile.xsl, in the
In addition to generating the standard XQuery Profiler report, you can save the raw data generated by the Profiler and use this data to create your own reports. See Enabling the Profiler for more information about this procedure.
A complete list of the videos demonstrating Stylus Studio's features is here: http://www.stylusstudio.com/xml_videos.html. About Performance MetricsThe XQuery Profiler can record three different levels of performance metrics:
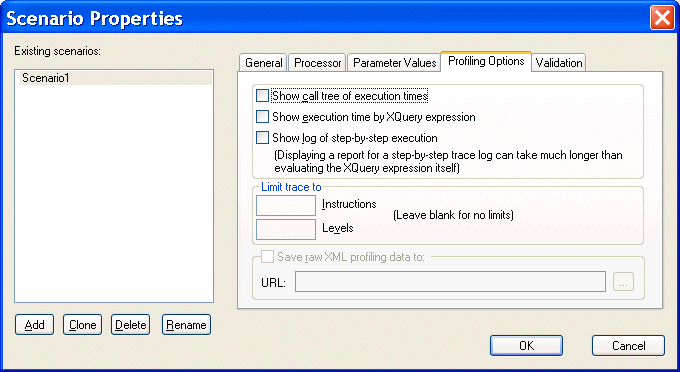
Enabling the ProfilerThe XQuery Profiler is off by default. You enable the Profiler on the Profiling Options tab of the XQuery Scenario Properties dialog box. To enable the XQuery Profiler:
1. Open the
Scenario Properties dialog box for the XQuery document. (Click
Browse
2. Click the
Profiling Options tab.
3. Select the settings for the performance metrics you want the Profiler to capture.
4. Optionally, save the raw Profiler data to a separate file.
5. Click OK.
The next time you preview the XQuery results, the performance metrics you selected are available to you in the XQuery Profiler report (and as raw data if you selected that setting and specified a file). Displaying the XQuery Profiler ReportTo display the XQuery Profiler report:
1. Ensure that the Profiler is enabled. (See
Enabling the Profiler if you need help with this step.)
2. Click the
Preview Result button (
3. Click the
Show Profiling Report button (
The XQuery Profiler report appears in the Preview window. |
XML PRODUCTIVITY THROUGH INNOVATION ™

 Cart
Cart


