Stepping Into a Node

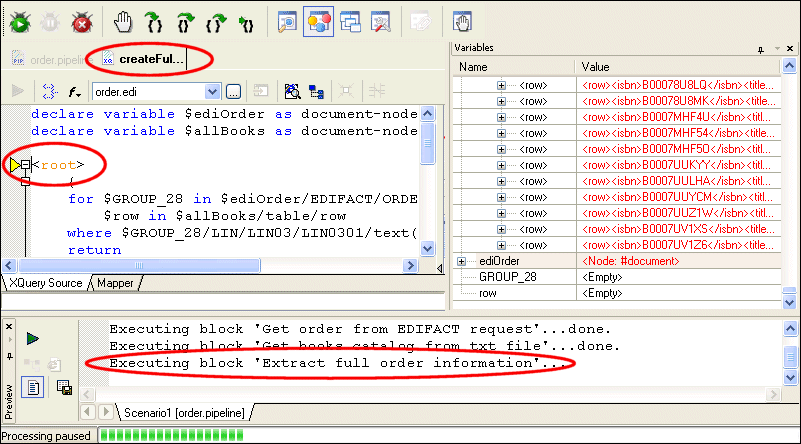
If we want to take a closer look at the XQuery node as it processes the input, we can step into it, directly from the XML Pipeline Editor by pressing the Step Into button ( ), or by pressing F11. When we step into a node, Stylus Studio opens the document the node represents (in this case, createFullOrder.xquery) in its own editor.

Figure 435. Stepping Into XQuery While Debugging XML Pipeline

When you step into another document from the XML Pipeline Editor, Stylus Studio pauses the debugger on the first instruction in that document. (In XQuery and XSLT, the pause symbol is a yellow triangle. You can step over the instructions, one-by-one, by clicking the Step Over button ( ) or pressing F10. You can set breakpoints within this document, as well.

You need to stop debugging before you can make changes to a document.

When the document you have stepped into has completed processing, you are returned to the XML pipeline, and you can continue debugging it.

Learn XSLT and XQuery Profiling

Stylus Studio's Profiler can help you evaluate the performance of your XQuery and XSLT. Automatically generated, customizable, easy-to-read HTML reports provide insight into performance bottlenecks.

XML Reports

Build beautiful XML reports from Relational, XML and Legacy Data. You XML report can be rendered in PDF or HTML using XSLT, XQuery or XSL:FO.

XML Schema Mapping

Stylus Studio includes a visual XML Schema-to-XML Schema mapping tool that allows you to easily implement sophisticated XML data mappings involving multiple data sources and customized data processing using either XSLT or XQuery code.

Food & Beverage Services

"I'll have a burger and a side of Stylus Studio", says these top food & beverage services that use Stylus Studio in everyday operations. Come see which food & beverage services eat up the idea of having the most powerful XML IDE at their finger tips!

Stylus Most Wanted

 
Free Stylus Studio XML Training:
W3C Member