Home >
Online Product Documentation >
Table of Contents >
Running the Debugger
Running the Debugger
To run the debugger, click the Start Debugging button (
 ) or click F5:
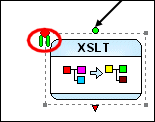
When the debugger hits a breakpoint you have set, it displays a pause symbol, like the one shown in
Figure 433.
|
|
Figure 433. Pause Symbol for a Debugging Breakpoint
When debugging is paused, debugging tools (like those that let you step into and over breakpoints, and toggles for the
Watch,
Variables, and
Call Stack windows) become active. You cannot edit the XML pipeline or alter its scenario properties during debugging, or when the debugger is paused.
|
|
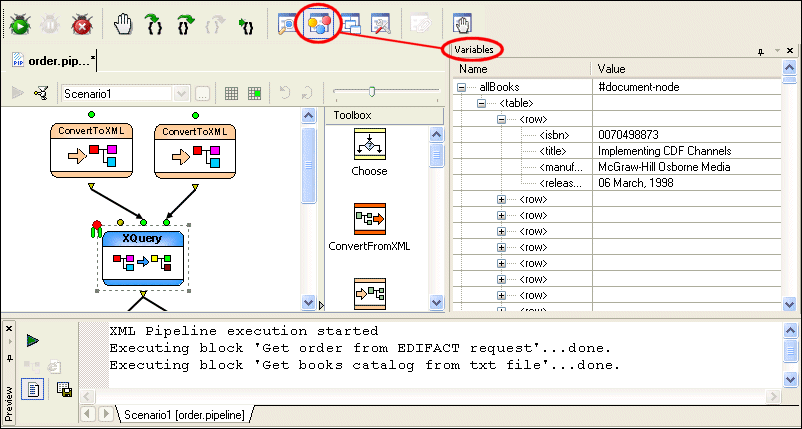
Figure 434. Debugging an XQuery Node in order.pipeline
Figure 434 shows a breakpoint set on the
createFullOrder.xquery node in
order.pipeline. The
Preview window shows the XML pipeline's execution log, and we can see in it that the two ConvertToXML nodes have just been processed; this is confirmed by the presence of the pause symbol on the following XQuery node - it has not yet been processed. The
Variables window shows the data retrieved from
booksXML.txt.
 Cart
Cart