Home >
Online Product Documentation >
Table of Contents >
Debugging XQuery Documents
Debugging XQuery Documents
Complex XQuery documents require robust debugging features.
|
|
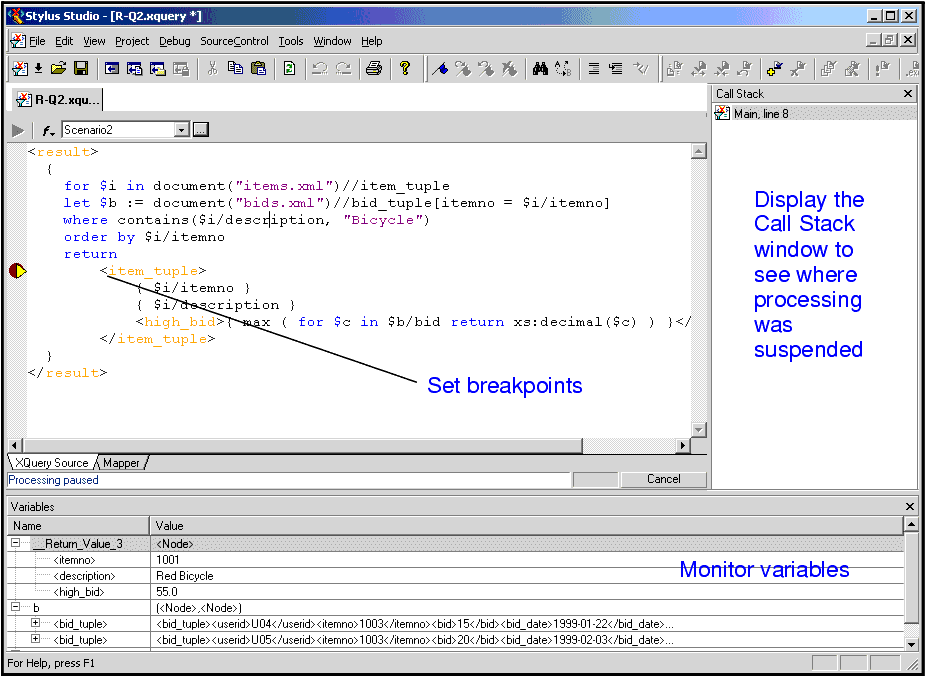
Figure 291. Debugging XQuery in Stylus Studio
With Stylus Studio, you can
- Set breakpoints in your XQuery documents
- Monitor the value of XQuery variables.
- Trace the sequence of XQuery expressions that created output. With a click anywhere in the result, Stylus Studio Visual Backmapping technology displays the XQuery expression responsible for creating that result.
This section covers the following topics:
Using Breakpoints
The Stylus Studio debugger allows you to interrupt XQuery processing to gather information about variables and XQuery expression execution at particular points.
Inserting Breakpoints
To insert a breakpoint:
1. In the XQuery document in which you want to set a breakpoint, place your cursor where you want the breakpoint to be.
2. Click
Toggle Breakpoint

or press F9. Stylus Studio inserts a blank stop sign

to the left of the line with the breakpoint.
Removing Breakpoints
To remove a breakpoint:
1. Click in the line that has the breakpoint.
2. Press F9 or click
Toggle Breakpoint.
Alternative: In the Stylus Studio toolbar, click
 Breakpoints to display a list of breakpoints in all open files. You can selectively remove one or more, remove them all, or jump to one of them.
Start Debugging
When your XQuery has one or more breakpoints set, start processing by clicking
Start Debugging
 or pressing F5. When Stylus Studio reaches the first breakpoint, it suspends processing and activates the debugging tools. After you examine the information associated with that breakpoint (see
Viewing Processing Information) you can choose to
or pressing F5. When Stylus Studio reaches the first breakpoint, it suspends processing and activates the debugging tools. After you examine the information associated with that breakpoint (see
Viewing Processing Information) you can choose to
|
Note
|
|
You can also click
Pause
 to suspend XQuery processing. Stylus Studio flags the line it was processing when you clicked
Pause.
to suspend XQuery processing. Stylus Studio flags the line it was processing when you clicked
Pause.
|
Viewing Processing Information
Stylus Studio provides several tools for viewing processing information. The tools become active when processing reaches a breakpoint. This section discusses the following topics:
Watching Particular Variables
Use the
Watch window to monitor particular variables. To display the
Watch window, click
Watch
 in the Stylus Studio toolbar. This button is active when Stylus Studio suspends processing because it reached a breakpoint. Stylus Studio displays the
Watch window only when processing is suspended.
in the Stylus Studio toolbar. This button is active when Stylus Studio suspends processing because it reached a breakpoint. Stylus Studio displays the
Watch window only when processing is suspended.
Enter the names of the variables you want to watch. You can enter as many as you like. When Stylus Studio suspends processing, it displays the current values for any variables listed in the
Watch window. You can expand and collapse complex structures as needed.
During XQuery debugging, you can enter XPath expressions in the
Watch window fields. Stylus Studio uses the current context to evaluate these expressions, and displays the results with the same kind of interface Stylus Studio uses for
nodeList and
node variables.
Evaluating XPath Expressions in the Current Processor Context
When you suspend processing, you can evaluate an XPath expression in the context of the suspended process. You do this in the
Watch window. Click
in the Stylus Studio toolbar to display the
Watch window. Click in an empty name field and enter an XPath expression. As soon as you press Enter, Stylus Studio displays the results of the evaluation in the
Value field of the
Watch window.
Obtaining Information About Local Variables
Display the
Variables window to obtain information about local variables. To display the
Variables window, click
Variables
 in the Stylus Studio toolbar. This button is active when Stylus Studio suspends processing because it reached a breakpoint. Stylus Studio displays the
Variables window only when processing is suspended.
in the Stylus Studio toolbar. This button is active when Stylus Studio suspends processing because it reached a breakpoint. Stylus Studio displays the
Variables window only when processing is suspended.
Information displayed in the
Variables window includes:
- Information about how the return value (displayed in the
Variables window as
__Return_Value_3, for example) is being built
- Local and global XQuery variable values
Also, you can navigate the structure associated with a variable, a parameter, or the current context if it is a node list or a node.
Displaying a List of Process Suspension Points
Display the
Call Stack window to view a list of the locations at which processing was suspended. For XQuery documents, Stylus Studio displays the XQuery document name and line number.
To display the
Call Stack window, click
Call Stack
 in the Stylus Studio toolbar. This button is active when Stylus Studio suspends processing because it reached a breakpoint. Stylus Studio displays the
Call Stack window only when processing is suspended.
in the Stylus Studio toolbar. This button is active when Stylus Studio suspends processing because it reached a breakpoint. Stylus Studio displays the
Call Stack window only when processing is suspended.
When processing is complete, the call stack is empty.
When execution is suspended you can use the
Call Stack window to jump directly to the XQuery source. Double-click on a stack line to go to that location. A green triangle appears to indicate this location in the source file.
Displaying XQuery Expressions for Particular Output
After you create an XQuery, or during XQuery debugging, Stylus Studio can display the XQuery expression that generated a particular part of a result document. This can be particularly helpful when the result is not quite what you want.
In the
Preview window, click on the output for which you want to display the XQuery expression. You can do this while either the text view or the browser view is active. Stylus Studio flags the line in the XQuery source that contains the expression that generated the output you selected.
Using Bookmarks
When you are editing or debugging a long file, you might want to repeatedly check certain lines in the file. To quickly focus on a particular line, insert a bookmark for that line. You can insert any number of bookmarks. You can insert bookmarks in any document that you can open in Stylus Studio.
Inserting
To insert a bookmark:
1. Click in the line that you want to have a bookmark.
2. Click
Toggle Bookmark

in the Stylus Studio toolbar. Stylus Studio inserts a turquoise box with rounded corners to the left of the line that has the bookmark.
Removing
To remove a bookmark:
1. Click in the line that has the bookmark you want to remove.
2. Click
Toggle Bookmark in the Stylus Studio toolbar. Stylus Studio removes the turquoise box.
To remove all bookmarks in a file, click Clear All Bookmarks
 .
.
Moving Focus
To move from bookmark to bookmark, click Next Bookmark
 or Previous Bookmark
 .
.
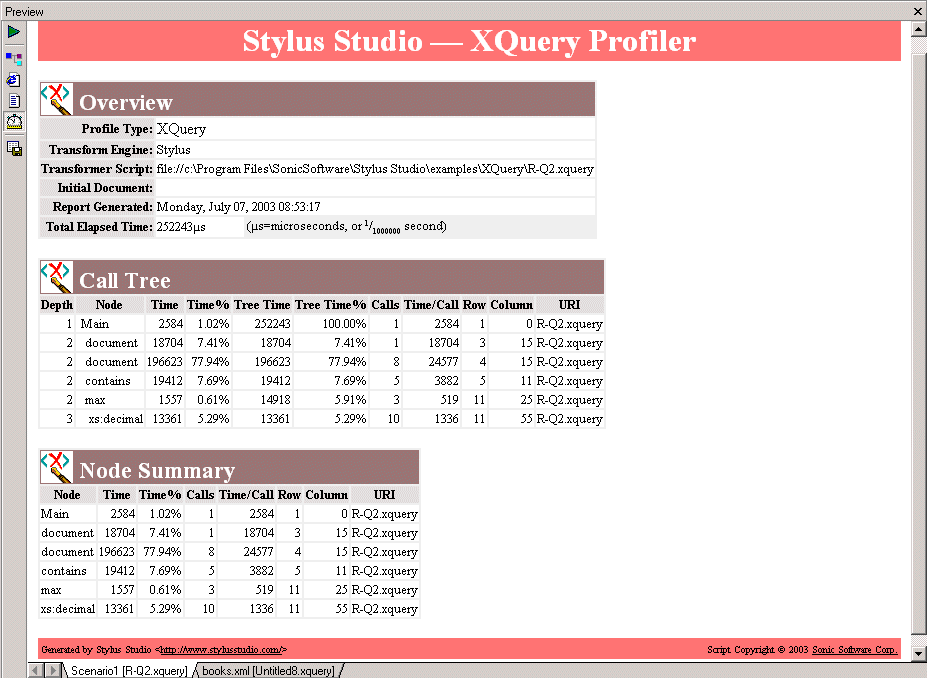
Profiling XQuery Documents
In addition to debugging tools for XQuery, Stylus Studio provides the
XQuery Profiler, a tool that helps you evaluate the efficiency of your XQuery. By default, the performance metrics gathered by the XQuery Profiler are displayed in a preformatted report, like the one shown here:
|
|
Figure 292. XQuery Profiler Report
The report format is controlled by the default XSLT stylesheet,
profile.xsl, in the
\Stylus Studio\bin directory. You can customize this stylesheet as required. You can save XQuery Profiler reports as HTML.
|
Note
|
|
XQuery and XSLT Profiler reports use the same XSLT stylesheet.
|
In addition to generating the standard XQuery Profiler report, you can save the raw data generated by the Profiler and use this data to create your own reports. See
Enabling the Profiler for more information about this procedure.
About Performance Metrics
The XQuery Profiler can record three different levels of performance metrics:
- A call tree of execution times
- Execution times by XQuery expression, and
- A detailed log of step-by-step expression execution
|
Note
|
|
Displaying the report for a step-by-step log can take significantly longer than evaluating the XQuery itself. Consider using the Profiler with the first two performance metric options. You can also use the
Limit Trace To fields to further restrict the Profiler's scope. If you find you need still more detail (while troubleshooting a performance bottleneck, for example), use the step-by-step setting.
|
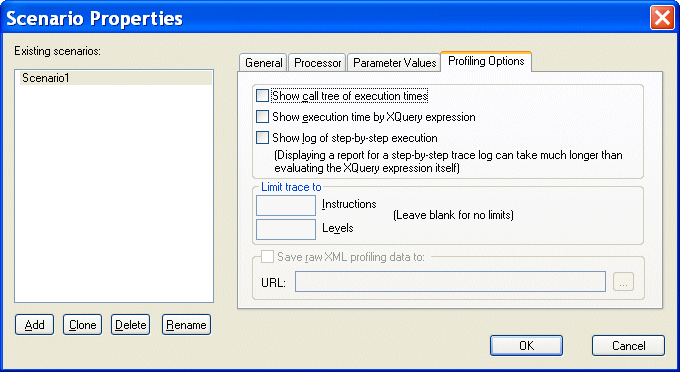
Enabling the Profiler
The XQuery Profiler is off by default. You enable the Profiler on the
Profiling Options tab of the XQuery
Scenario Properties dialog box.
To enable the XQuery Profiler:
1. Open the
Scenario Properties dialog box for the XQuery document. (Click
Browse

at the top of the XQuery editor window.)
2. Click the
Profiling Options tab.
|
|
Figure 293. XQuery Profiler Options
3. Select the settings for the performance metrics you want the Profiler to capture.
4. Optionally, save the raw Profiler data to a separate file.
|
Note
|
|
This option is available only after you select one or more performance metrics settings.
|
5. Click OK.
The next time you preview the XQuery results, the performance metrics you selected are available to you in the XQuery Profiler report (and as raw data if you selected that setting and specified a file).
Displaying the XQuery Profiler Report
To display the XQuery Profiler report:
2. Click the
Preview Result button (

).
3. Click the
Show Profiling Report button (

).
The XQuery Profiler report appears in the
Preview window.
 Cart
Cart