|
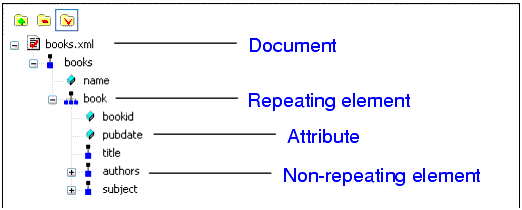
Home > Online Product Documentation > Table of Contents > Example: Dropping a Repeating Node Example: Dropping a Repeating NodeAs described earlier, the data source - whether it is an XML document, a relational database table, an EDI file converted to XML, or some other XML data source - is represented as a data model in the data sources panel. The glyphs used for the nodes are based on the object they represent in the data source, as shown here.
For this example, we use
The following table summarizes the types of components you can create and automatically populate with data based on the node type.
See Working with Report Components for information about specific components. |
XML PRODUCTIVITY THROUGH INNOVATION ™

 Cart
Cart


