Cart
Cart|
Home >Online Product Documentation >Table of Contents >Images ImagesAn image is a component that contains a GIF, JPEG, or some other graphic file. You can place image components within other components (like tables, lists, and repeaters, for example), or directly on the report body. Creating an ImageTo create an image component:
1. Click the canvas where you want to insert the image component.
2. Select Report > Insert > Image from the menu.
Alternative: Right-click and select Insert image from the short-cut menu.
3. Specify the location of the image file(s). See Specifying an Image Source for more information.
Graphical RepresentationIn the XML Publisher canvas, an image is represented as a small square with a cross-hatched pattern. Figure 466 shows an image component that includes some text to its right - (photo of the author). Images are resolved when you preview the report only if the image files are accessible to Stylus Studio using the source information you have specified. Unresolved images are rendered as red Xs, as shown in Figure 467: Specifying an Image Source
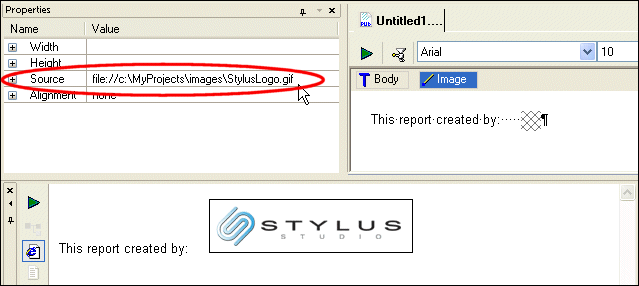
You can use static and dynamic images in a report. A static image is one that never changes. An example of a static image is a corporate logo that appears in a fixed place on a report. To specify a static image, just the complete file URL in the image's Source property -
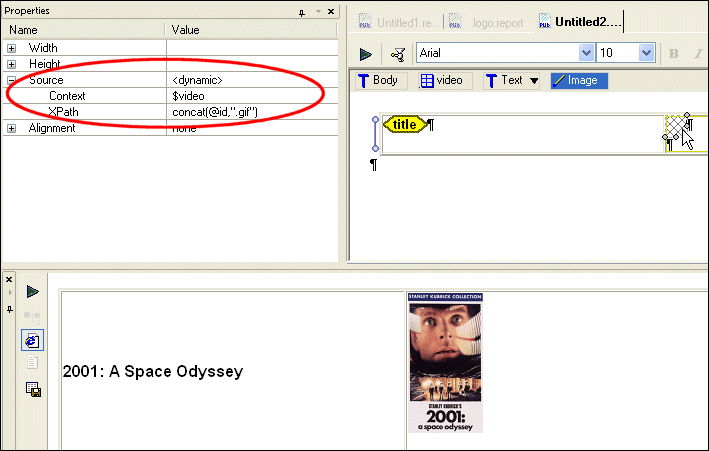
A dynamic image is one whose source changes based on the context defined for it. An example of a dynamic image is the cover art for the movies in the To specify a dynamic image, you need to define the image component's Source property's Context and XPath sub-properties:
When you specify these properties, Stylus Studio displays <dynamic> in the Source property field.
Example: Specifying a Dynamic Image Source
The cover art for the movies in the To create this report in XML Publisher, we would:
1. Create a table by dragging the video repeating element and dropping it on the canvas. This establishes the context for the cells in the table, as well as creating a value, $video, that represent this context.
2. Drag and drop the title element in the table's first cell (as a value).
3. Right-click and insert an image component in the table's second cell.
4. Specify the context for the image:
a. Change the image component's Context sub-property to $video. The context for this variable (result/videos/video) was established automatically when we used the video repeating element to create the table.
b. Change the image component's XPath sub-property to concat(@id)".gif". This concatenates the value of the current id attribute with the string .gif to identify image file to display. The source for these image files is specified in the following step.
5. Specify the source for the image files - change the body component's Base URI property to c:\Program Files\Stylyus Studio\examples\VideoCenter\images, or wherever you have installed Stylus Studio.
Specifying Image SizeBy default, Stylus Studio displays the image in the finished report using the source file's dimensions. You can use the image component's Width and Height properties to specify a different size. When you do this, Stylus Studio changes the dimensions of the image glyph (see Figure 466) on the canvas to reflect the change. |
XML PRODUCTIVITY THROUGH INNOVATION ™