
Greetings from Stylus Studio!
Last month's article "Mapping Farmers' Markets in Google Earth using XSLT" was very popular and we want to thank everyone who enjoyed reading it and responded. We continue to make Stylus Studio the best XML IDE and provide you with relevant content.
This month we are taking a look at building business dashboards using XSLT. Dashboards are a perfect way to display and monitor information, applications and more.
Upgrade to X14
We believe that all of our Stylus Studio Customers who have older releases should get the benefits of Stylus Studio X14, the latest and greatest release.
Email niki.peckham@ivitechnologies.com for great upgrade pricing! Please include your current activation key.
|
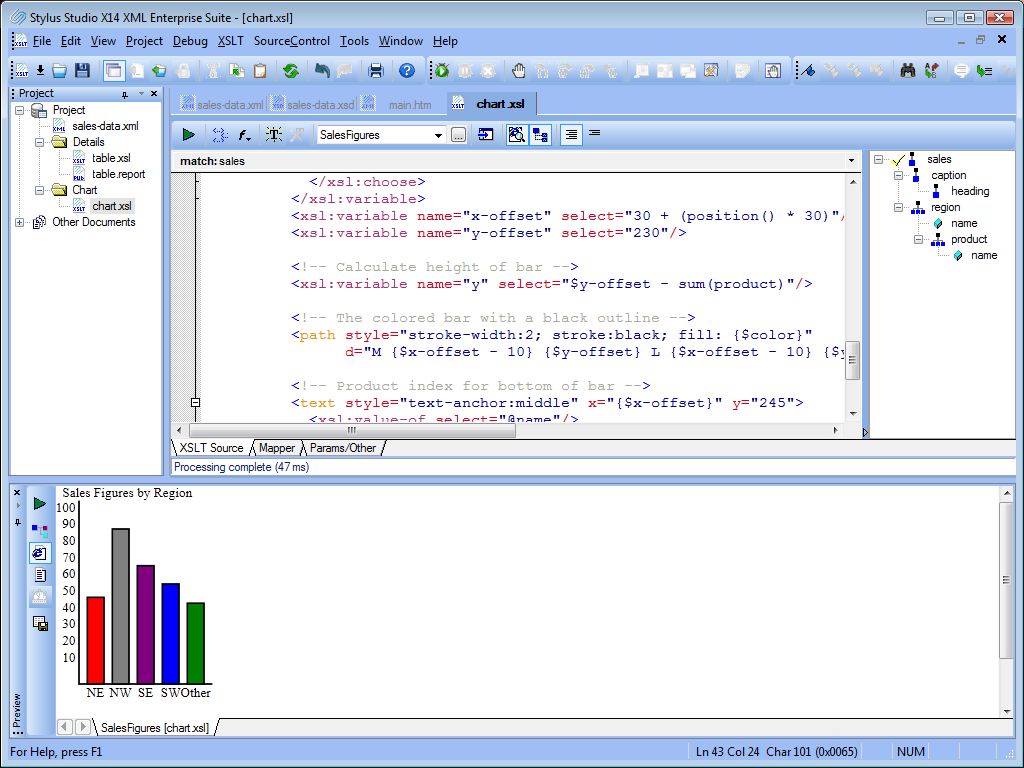
Building Business Dashboards Using XSLT
Today’s economy has dramatically changed the way companies do business. Having an online presence is no longer sufficient, and order management systems have to be real-time and accessible on a large variety of devices: desktops, laptops, tablets, mobile phones. In this article, we will look at how to build a simple but modern dashboard for publishing sales results. We will combine proven standards, like XML and SVG (Scalable Vector Graphics) that are integral parts of any enterprise platform, with innovative new trends like HTML 5 mobile browser. Read the Full Tutorial >Mapping Farmers' Markets in Google Earth using XSLT
In the last few years, governments around the world have started investing significant resources to bring a tremendous amount of data online and make it available to the public, not only to improve transparency but also to give third parties the power to build very interesting applications. This fascinating archive includes an interesting document entitled 'Farmers' Markets Geographic Data'. While our world is maturing, we have come to realize the importance of getting our fruits and vegetables locally to reduce carbon emissions and to help the local economy. We thought it would useful to be able to convert the report to a format that can be rendered on a map to easily determine where farmer's markets are located nearby. Read the Full Story > |
Email us at stylusstudio@stylusstudio.com with any cool examples that you would like to share and we might publish it in an up coming Stylus Scoop.
Connect with Stylus
  |


Copyright © 2012 IVI Technologies Inc. All Rights Reserved.
This message was sent because you have expressed interest in Stylus Studio through the Stylus Studio website. In accordance with our Privacy Policy, if you would prefer not to receive further notifications or email communications of this type, please go to the following web page and update your subscription profile, or contact us through postal mail at: IVI Technologies Inc., c/o Stylus Studio Consumer Affairs Office, 8672 SW 40 Street, Suite 206, Miami, FL,33155, USA.
View the trademarks, service marks, or registered trademarks of DataDirect Technologies in the U.S. and other countries. Any other trademarks or service marks contained herein are the property of their respective owners. All rights reserved.